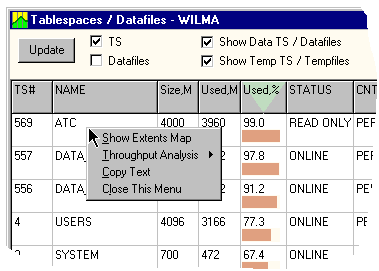
Along with details on Tablespaces and Datafiles, this window provides I/O data, both current and historical. The information is presented in tabular views combined with performance graphs. Data can be sorted using different columns, quickly identifying hot tablespaces, datafiles and disks. This window uses data from dba_tablespaces, dba_data_files, dba_free_space, v$datafile, and v$filestat views.
There are two tabular views in this window: Tablespaces and Datafiles, with a master-detail relationship between them. As you select a tablespace, corresponding datafiles appear in the Datafiles view. This default setting can be changed, making either Tablespace or Datafiles view shown in the window. Two checkboxes, "TS" and "Datafiles", define which tabular view is shown.
Two more check boxes, "Show Data TS / Datafiles" and "Show Temp TS / Tempfiles", filter rows of the Tablespaces / Datafiles views.
In the Tablespace and Datafile views, the last three columns represent I/O statistic in three different formats: Total - cumulative statistic value, Delta - differentiated value, Chart - recent history of Delta shown as a graph. In the "I/O options" panel, specify what data should be in the I/O columns. The radio button "I/O Activity By" section specifies which I/O statistics is presented. Three options, I/O Number, DB Blocks, and I/O Time, correspond to the following I/O statistics in v$filestat view:
Two check boxes, "Read Activity" and "Write Activity", define the type of I/O activity in the I/O columns. Read activity is shown in blue color, Write activity in red. If both Read and Write Activity boxes are checked, data is shown as stacked graphs. The I/O columns can be hidden by unchecking both "Read Activity" and "Write Activity" boxes. The list can be sorted by any column(s); when sorted on a chart column, an average value is used. To see a more detailed chart of statistic history, click on the graph in the list.
This window can be used as a convenient place to call the Segments and Extents window in the context of a selected Tablespace or Datafile. Right-click on the desired record to get a pop-up menu like this one shown on the picture:

These are the following options in this pop-up menu:
The Tablespaces and Datafiles window offers shortcuts to visualize the linearity of the I/O throughput by drawing two statistics, one against the other. For example, you can check how different read rates correlate to the time required to complete these reads. Or, for OLTP system, the number of I/O at different rates can be compared to the time required to complete these reads. By detecting the saturation of the disk system by I/O number or by volume of data, one can deduct throughput limits of the I/O system or conclude if it is reaching its capacity. Lab128 offers two predefined options, "Blocks vs Time" and "I/Os vs Time", at the tablespace or datafile level. If needed, you can make your own I/O statistics that combine several tablespaces/datafiles and draw them against each other. See also Correlation Analysis window help for more details.

These two options can be selected by the Throughput Analysis item of the pop-up menu. There are two submenus: DB Blocks vs. I/O Time and I/O Number vs. I/O Time. Each one has similar submenus where you can select Read, Write, or a sum of both. Selecting items in this last menu will open the Correlation Analysis window, pre-configured according to your menu choice.