The Activity Explorer window provides powerful insight into Oracle activity: current and historical. It quickly displays performance bottlenecks and identifies resources and individual SQL statements responsible for delays in server response at any current or historical period. This information enables database administrators to pinpoint the problem and predict how much time will be gained by fixing it. The Response time-based Oracle tuning gained a lot of attention in recent years. The approach is based on Oracle Wait Interface (OWI) represented by the v$system_event, v$session_event and v$session_wait views. Oracle 10g extended OWI, including v$session_wait into v$session and introducing v$active_session_history view. More specifically, v$active_session_history is a collection of v$session view snapshots taken at a regular time interval for the active sessions. Lab128 uses a similar collection technique although it is not dependent on v$active_session_history, so it is compatible with older versions. For Oracle 10g, you can choose to use ASH (although it's not necessary) to pre-populate Lab128 with collected data. Please note that v$active_session_history view is a part of the Oracle 10g Diagnostic Pack and requires a purchase of the ODP license. Therefore, Lab128 provides additional savings by implementing ASH functions and not requiring the purchase of ODP.
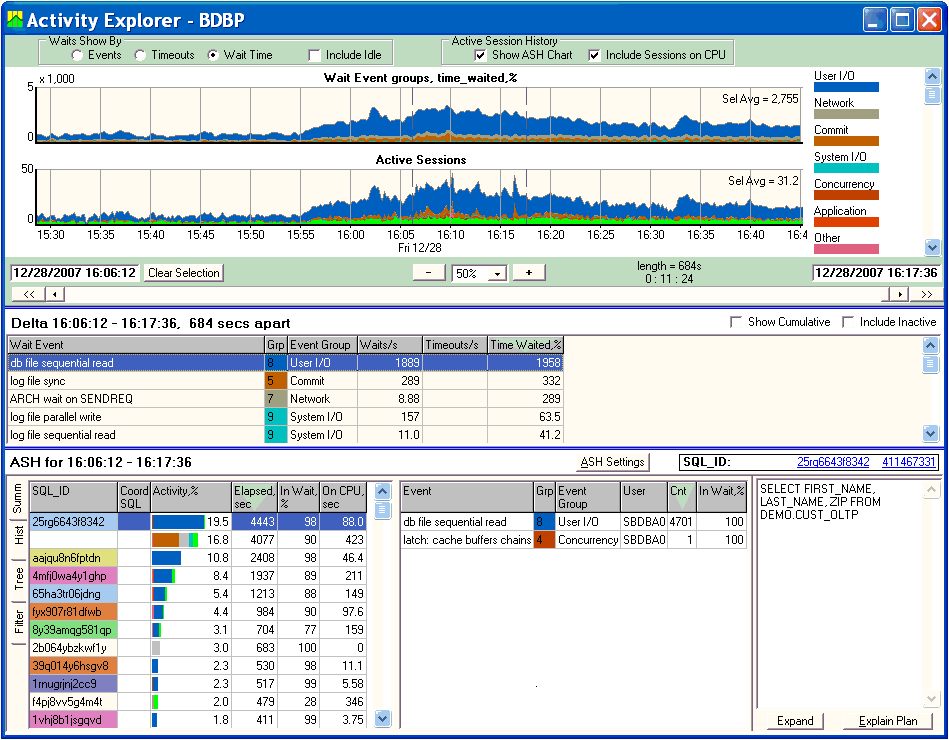
This window has three parts: upper - the system wait event charts; middle - the tabular view of system wait values, and lower - Active Session History (ASH), see the picture:

The system event chart provides quick overview of activity and identifies spikes of activity. Select the area you want to explore deeper (see Selecting a time interval and Average value for more information on how to make a selection). The tabular view shows the top system events and numerical data about them. Here you can identify which database resources were the biggest bottlenecks during a selected time period. The lower Active Session History part shows which SQL statement took the most time to execute and shows wait time broken down by different events. These SQL statements should be examined more closely as they are potential candidates for tuning or other actions. The text of a selected statement is displayed in the right side while the Explain Plan for the statement can be called by clicking the "Explain Plan" button. The Active Session History has a second tabbed view, "History", where every captured active session record can be examined. ASH settings can be viewed and changed using the "ASH Settings" button (see also Settings window).
There are different measures for Oracle wait events. Select them in the "Show By" radio button box.
Available options are: Events, Timeouts, Wait Time. These measures correspond to the three columns in v$system_event view:
TOTAL_WAITS - The total number of waits for this event;
TOTAL_TIMEOUTS - The total number of timeouts for this event;
TIME_WAITED - The total amount of time waited for this event, in hundredths of a second.
Since all measures in v$system_event are cumulative, Lab128 differentiates them in time, providing data that can be viewed and analyzed. The derived information is sorted in descending order so that the largest contributor(s) to wait events can be easily identified.
The event group charts are presented as a stack of charts, each of a different color, with the largest contributor being on top, the second largest below and so on. The Legend section on the right translates colors to corresponding event groups.
The check box "Show ASH Chart" brings up or hides a chart showing active sessions as a stack of charts using the same colors for wait groups as mentioned above. To show active sessions running on CPU, check "Include Sessions on CPU" box. Sessions on CPU are shown in green color.
There was no "official" classification of events before Oracle version 10. Each tool used to have its own event grouping. Starting with Oracle 10, there is a new column WAIT_CLASS in v$event_name view. So in Lab128, the events are internally categorized into Oracle 10g-style groups.
For those folks who prefer different grouping, Lab128 provides the opportunity to customize Events grouping through the ev_group.ini file, which Lab128 reads on startup, if it exists. In order to define your own grouping, first dump the existing grouping into the file using "Options | Dump Events and Groups into File" main menu. This will create ev_group.sample text file in the Lab128 working directory. Then open this file in any editor. Follow the instructions at the beginning of the file.
The view mode depends on the type of time selection: unselected, point in time selected, period of time selected. Time selection can be done in the Chart area by clicking over the chart, moving to another point, and releasing the mouse button (see Selecting a time interval and Average value for more information on how to make a selection). The mode of each tabular view is shown on top. These modes are:
To include columns with wait cumulative values, check the "Show Cumulative" box.
The check box "Include Inactive" filters out events that have cumulative values of 0.
Check this box if a list of all Oracle events is needed, including inactive ones.
To view a chart for an individual wait event, select it in the list of events, then right-click and choose "Show Chart for selected event" in the pop-up menu.
By default, the Summary view is displayed when the Activity Explorer window opens. Select a statement to view its SQL text and waits broken down by individual wait events. Click on the "History" tab to see every active session record captured in the selected time period. The list is sorted by statement ID, then by capture time. This makes it easy to follow the individual statement's stages of execution. Switch back to the "Summary" view by clicking on the "Summary" tab.
Click on the "Tree" tab to explore ASH data aggregated by user-defined dimensions and presented in a tree view. For example, to see which SQL statements contributed to wait events, select "Event" in the first Group By box and "SQL" in the second box. There are up to 4 levels available to group by.
The information presented in the "Summary", "History" and "Tree" views can be filtered by setting criteria in the "Filters" form. Click on the "Filters" tab and use the drop-down lists to choose values for the corresponding columns. All filtering criteria are ANDed; the Summary and History views will update automatically to satisfy new filter values.
The Active Session History collection parameters can be changed in the Settings window. The ASH settings affect the time resolution and precision of reported numbers and the time length of the history. There are optional v$session columns that can be added to the data collection. Also, certain types of sessions can be filtered out from the history collection process. See Lab128 Settings window help for more details.
Wait Event - The name of the wait event (v$system_event.EVENT);
Grp - Lab128 assigned group number (see also Event grouping above);
Event Group - Lab128 assigned group name (see also Event grouping above);
Waits - The total (cumulative) number of waits for this event (v$system_event.TOTAL_WAITS);
Waits/s - The number of waits per second (delta of v$system_event.TOTAL_WAITS);
Timeouts - The total (cumulative) number of timeouts for this event (v$system_event.TOTAL_TIMEOUTS);
Timeouts/s - The number of timeouts per second (delta of v$system_event.TOTAL_TIMEOUTS);
Time Waited - The total (cumulative) amount of time waited for this event, in hundredths of a second (v$system_event.TIME_WAITED);
Time Waited,% - The amount of time waited per second - or percentage of time waiting for this event (delta of v$system_event.TIME_WAITED). It should be noted that several sessions may be waiting simultaneously for the same event, so the sum may exceed 100%!
TimeStamp - Time when record was captured;
SID - Session ID of the active session (v$session.SID);
OID - SID of the owner session / PQ coordinator (derived from v$session.OWNERID);
User - Oracle user name (v$session.USERNAME);
SQL_Hash - SQL Hash value (v$session.SQL_HASH_VALUE);
Seq - Sequence number that uniquely identifies this wait. Incremented for each wait. (v$syssion_wait.SEQ#);
State - Wait state. Values: "Waiting" or empty if this wait already completed (derived from v$syssion_wait.STATE);
Event Summary - Wait event or resource for which active session was waiting (synthesized from v$session_wait.EVENT, v$session_wait.P1, P2, and P3. When Block# is supplied, Lab128 fetches internally the segment name and type);
P1_TEXT - Description of the first additional parameter in v$session_wait (v$session_wait.P1_TEXT);
P1 - First additional parameter in v$session_wait (v$session_wait.P1);
P2_TEXT - Description of the second additional parameter in v$session_wait (v$session_wait.P2_TEXT);
P2 - Second additional parameter in v$session_wait (v$session_wait.P2);
P3_TEXT - Description of the third additional parameter in v$session_wait (v$session_wait.P3_TEXT);
P3 - Third additional parameter in v$session_wait (v$session_wait.P3);
WT - v$session_wait.WAIT_TIME;
SW - v$session_wait.SECONDS_IN_WAIT;
Service - Service name of the session v$session.SERVICE_NAME;
EntProc - Top-most PL/SQL subprogram on the stack (10.2.0.2+); NULL if there is no PL/SQL subprogram on the stack (v$session.PLSQL_ENTRY_OBJECT_ID and v$session.PLSQL_ENTRY_SUBPROGRAM_ID; names are looked up from dba_procedures);
CurrProc - Currently executing PL/SQL subprogram; NULL if executing SQL (v$session.PLSQL_OBJECT_ID and v$session.PLSQL_SUBPROGRAM_ID; names are looked up from dba_procedures);
Bl_Inst - Instance ID of blocking session (v$session.BLOCKING_SESSION);
Bl_SID - SID of blocking session (v$session.BLOCKING_SESSION);
Blocker - If this session is blocker, then value is "Y" (derived by join to v$sessiont.BLOCKING_SESSION);
Object - Object corresponding to Object ID, see next column (derived from v$session.ROW_WAIT_OBJ#);
Obj ID - Object ID for the table containing the row specified in ROW_WAIT_ROW# (v$session.ROW_WAIT_OBJ#);
FILE - Identifier for the datafile containing the row specified in ROW_WAIT_ROW#. This column is valid only if the session is currently waiting for another transaction to commit and the value of ROW_WAIT_OBJ# is not -1(v$session.ROW_WAIT_FILE#);
BLOCK - Identifier for the block containing the row specified in ROW_WAIT_ROW#. This column is valid only if the session is currently waiting for another transaction to commit and the value of ROW_WAIT_OBJ# is not -1 (v$session.ROW_WAIT_BLOCK#);
ROW - Current row being locked. This column is valid only if the session is currently waiting for another transaction to commit and the value of ROW_WAIT_OBJ# is not -1 (v$session.ROW_WAIT_ROW#).
SQL_Hash - SQL Hash value (v$session.SQL_HASH_VALUE);
Coord SQL - SQL Hash value of the Owner / PQ coordinator session (v$session.SQL_HASH_VALUE, join by v$session.SID=v$session.OWNERID);
Activity,%- Colored bars show the percentage of wait classes out of all waits for a selected period of time;
Elapsed, sec- Elapsed time (derived from TimeStamp and ASH capture rate);
In Wait, %- Percent of the time when execution of the statement was waiting (aggregated from v$syssion_wait.STATE);
On CPU, sec- Amount of time when execution of the statement was running on the CPU (derived from "Elapsed, sec" and "In Wait, %").
Event - Wait event or resource for which active session was waiting (v$session_wait.EVENT);
User - Oracle user name (v$session.USERNAME);;
Cnt - Number of observations of this event (number of records captured in History);
In Wait, %- Percent of observations when waiting for this event (number of records captured in History with State="Waiting")