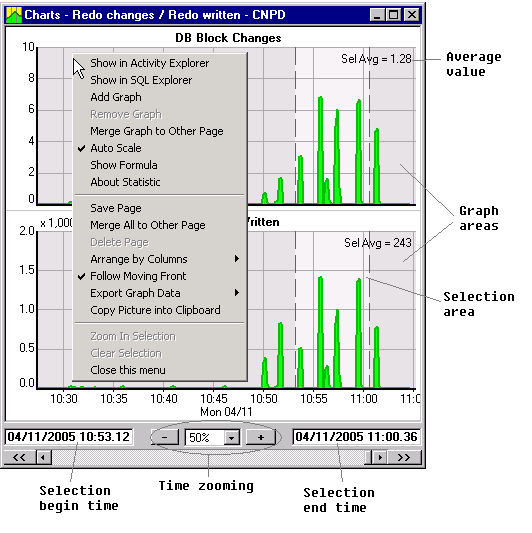
The Statistic Detailed Charts window allows you to combine several statistics in one window and see them in fine detail. The collection of charts is called a Page; you can give a name to the Page by saving it. The saved page can be opened later. The charts can be viewed using different time scales. The statistics can be added to the Page or removed at any time.
The Detailed Charts window opens up when a simple graph is clicked. When at least one Detailed Chart is opened, you can add more statistics by holding the Shift or Ctrl key and clicking on another simple graph. When it is unclear which Detail Charts window is the destination, a list will pop up prompting the user to select the proper window.
As already mentioned, a collection of detailed charts is called a Charts Page. The Detailed Charts window and the Charts Page mean the same thing, so they will be used interchangeably. Please note: the Page can be embedded in another window, such as the Statistic Correlations window. The embedded Page has almost the same behavior and semantics.
If a new Page doesn't have a name, you can name it by saving it. As soon as the Page is saved, it can be opened at any time.
All options and actions of the Page are accessible through the pop-up menu. The pop-up menu is opened by right-clicking anywhere in the chart area.
There can be as many as 60 charts added to a Page. Change their appearance by specifying the number of vertical rows (columns) the charts should be arranged in. Select this in the "Arrange by Columns" pop-up menu item.
By default, the graphs show the latest time interval and they automatically scroll left as time goes by and new points are added. To scroll back in time, right-click at some point on the graph, hold the mouse button and move it left or right. The graphs will scroll following your movements. You can also use the scroll bar at the bottom of the window to scroll back and forth. To change the time scale, use the buttons "+" - zooming in and "-" - zooming out, or choose the zoom level in the drop-down list.
By default, each graph has its vertical axis scaled automatically. To change the scale (and turn autoscale mode off), right-click at some point on the graph, hold the mouse button and move it up or down. The vertical scale will adjust following the mouse movements. To return to autoscale mode, use the "Autoscale" item in the pop-up menu.
There are three modes of time selection: unselected (default), point in time selected, period of time selected. The mode of selection affects the Average value that shows in the upper right corner of the chart. This mode also affects how other data is reported in the Activity Explorer, Latches, and Correlation Analysis windows.
By default, no time selection is done and the Average value refers to the time range of the visible part of the graph. If a value at some point in time is needed, click in the graph area and the point will be marked by dashed line. The corresponding time will show in the left box of the bottom part of the window. This is the "point in time" selection mode. The third mode, "period of time", can be selected in a very similar way as it is done in word processors when selecting text: click at first border, hold the mouse button, and move it to the other border. As the mouse moves, selection is shown in gray color (see picture below). Alternatively, click and release to anchor the first border, then press the Shift key and click to mark another border. The time of borders will show in the left and right boxes in the bottom part of the window. The Average value will show the average for the selected time period.
