The query in this example deals with two tables: EMP_TEST, the employee table with 1 million rows, and DEPT_TEST, the department table with 100 rows. There is one-to-many relationship between these two tables: each employee belongs to a department. The employees are more or less evenly and randomly distributed between departments, with each department having about 10,000 employees. You can reproduce this test case using the script below.
The query pulls a set of employees with employee IDs in the range from 1 to 1000; therefore, 1000 rows are expected. Also, we need to see department info, so we have to join to the department table. As part of department info, we need to include a column showing how many employees are in the department - this information is not stored in the department table, so the query should derive that on the fly.
Here is the query:
select EMPNO, ENAME, HIREDATE, e.DEPTNO, DNAME, EMP_COUNT
from
  EMP_TEST e,
  DEPT_TEST d,
 (select DEPTNO, count(*) EMP_COUNT from EMP_TEST group by DEPTNO) c
where
 EMPNO between 1 and 1000
 and e.DEPTNO=d.DEPTNO
 and e.DEPTNO=c.DEPTNO;
The query joins three datasets, EMP_TEST, DEPT_TEST, and result set of a subquery (c). The EMP_TEST table has a unique index (primary key) on empno column and another index on deptno column. The DEPT_TEST table has a unique index (primary key) on deptno column. Both tables have statistics, but there are no column statistics.
Thinking about options to execute the query, there are a few relatively obvious things:
This seems to be a good strategy. Because employee rows are distributed randomly between departments, there is a good chance that 1000 rows will refer to all or almost all departments. If they were all in the same department, or just few of them, we could improve our strategy by running a range scan on the EMP_TEST(deptno) index. But that is not the case, so we have to conclude that the most efficient strategy is the one described above.
Let's explain the plan of the query:
------------------------------------------------------------------------------------------------
| Id  | Operation                      | Name          | Rows  | Bytes | Cost (%CPU)| Time     |
------------------------------------------------------------------------------------------------
|   0 | SELECT STATEMENT               |               |       |       |   598 (100)|          |
|   1 |  HASH GROUP BY                 |               |  2495 |   126K|   598   (6)| 00:00:08 |
|*  2 |   HASH JOIN                    |               |  2495 |   126K|   596   (5)| 00:00:08 |
|   3 |    NESTED LOOPS                |               |  2495 | 97305 |    38   (3)| 00:00:01 |
|   4 |     TABLE ACCESS BY INDEX ROWID| EMP_TEST      |  2495 | 72355 |    36   (0)| 00:00:01 |
|*  5 |      INDEX RANGE SCAN          | PK_EMPNO      |  4491 |       |    12   (0)| 00:00:01 |
|   6 |     TABLE ACCESS BY INDEX ROWID| DEPT_TEST     |     1 |    10 |     1   (0)| 00:00:01 |
|*  7 |      INDEX UNIQUE SCAN         | PK_DEPTNO     |     1 |       |     0   (0)|          |
|   8 |    INDEX FAST FULL SCAN        | IX_EMP_DEPTNO |   997K|    12M|   547   (3)| 00:00:07 |
------------------------------------------------------------------------------------------------

Predicate Information (identified by operation id):
---------------------------------------------------
   2 - access("E"."DEPTNO"="DEPTNO")
   5 - access("EMPNO">=1 AND "EMPNO"<=1000)
   7 - access("E"."DEPTNO"="D"."DEPTNO")
So far the SQL optimizer has been following our strategy. Note, that the estimated cardinality 4491 rows for the index is different from the expected 1000 - this can be explained by the absence of column statistics. The cardinality 2495 rows from EMP_TEST seems to be a surprise, given the fact that the EMP_TEST(EMPNO) index is unique. Anyway, even though the estimate of 2495 rows is not perfect, it is not too far from what should be expected during the execution.
The real surprise is how the query optimizer decided to process the subquery. The HASH JOIN (2) operation joins the data set created by the nested loops (3), and another temporary data set created by INDEX FAST FULL SCAN (8) operation of the IX_EMP_DEPTNO index. The IX_EMP_DEPTNO (EMT_TEST(DEPTNO)) index is not unique; there are 1,000,000 entries in this index and on average 10,000 entries per distinct DEPTNO key. Let see what is going to happen when 1000 rows are joined to 1,000,000 rows on the DEPTNO column. Every row in the first data set is joined to a multiple number of entries in the second data set - on average 10,000 - producing a very large internal data set: 1000 rows in (3) x 10,000 entries in (8) = 10,000,000 rows. It doesn't matter what type of join is used, it is what relational algebra dictates. Then finally, the GROUP BY operation (1) is applied on this large internal data set. In our strategy, the GROUP BY was to be executed for the subquery's data set only. The optimizer decided to transform the plan and execute the GROUP BY as the last operation.
Ouch! This is not optimal at all. But the optimizer sees it differently. Look at the cardinality in step (2) - 2495 rows. The optimizer assumes that every row in (3) will be joined to only 1 row in (8). It seems that even without column statistics, the optimizer should be able to better estimate the outcome of the join using statistics on this index, see NUM_ROWS and DISTINCT_KEYS values:
Index Statistics - IX_EMP_DEPTNO| Value | Value | Value | |||
| LAST_ANALYZED | 18.10.2010 3:18:16 AM | AVG_LEAF_BLOCKS_PER_KEY | 19 | MBYTES | 16 |
| UNIQUENESS | NONUNIQUE | AVG_DATA_BLOCKS_PER_KEY | 4,460 | BYTES / ROW | 16.8 |
| NUM_ROWS | 1,000,000 | CLUSTERING_FACTOR | 446,028 | ROWS / LEAF_BLOCK | 512 |
| LEAF_BLOCKS | 1,954 | SAMPLE_SIZE | 1,000,000 | EXTENTS | 31 |
| DISTINCT_KEYS | 100 | BLEVEL | 2 | BLOCKS / EXTENT | 66.1 |
It is out of scope of this article to find out why this happens; it can be a result of missing functionality in the query optimizer. The point is that this plan is reproducible in many versions, including 11g R2; we are going to execute this query and collect the plan statistics to confirm our findings. We are going to use Lab128's built-in support for SQL execution with Plan Statistics enabled. See SQL Plan Statistics for more details. We are also going to use Lab128's Explain Plan window which is capable of combining plan statistics with the traditional presentation of the execution plan.
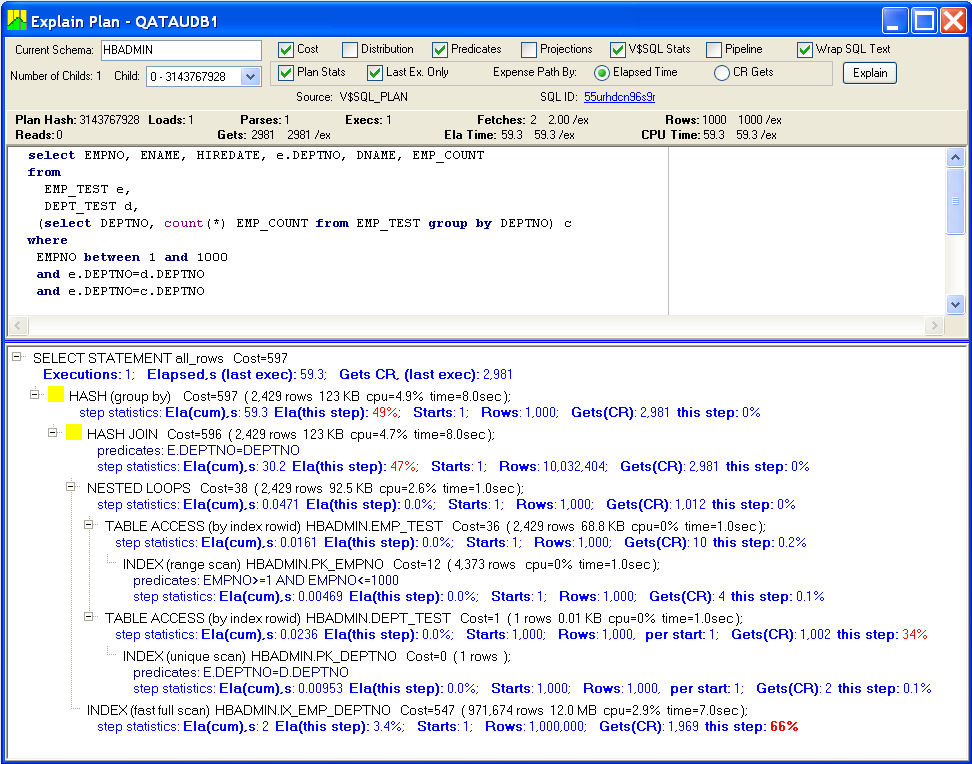
After executing this query, here is what SQL plan statistics are:

There is nothing unexpected on the first steps of the plan:
Up to this point (NESTED LOOPS), the execution was going fast: total elapsed time was .047 second. Number of rows in the internal data set: 1,000. Number of gets: 1,012.
As predicted, bad things started happening on HASH JOIN steps, where every row from the NESTED LOOPS step was joined to EMP_TEST represented by the IX_EMP_DEPTNO index:
This example will not be complete without trying to fix the query. The root problem, as we have seen in previous section, was that SQL optimizer merged the subquery and moved GROUP BY to the end of execution. We can try to prevent this transformation, forcing GROUP BY to be a part of subquery. First, let's do the old trick of adding redundant "rownum > 0" condition to the subquery, which worked in many Oracle versions. Second, we will prevent the transformation with an Oracle hint.
Using "rownum > 0". This old trick prevents the subquery from merging with the rest of query.
select EMPNO, ENAME, HIREDATE, e.DEPTNO, DNAME, EMP_COUNT
from
  EMP_TEST e,
  DEPT_TEST d,
 (select DEPTNO, count(*) EMP_COUNT from EMP_TEST where rownum > 0 group by DEPTNO) c
where
 EMPNO between 1 and 1000
 and e.DEPTNO=d.DEPTNO
 and e.DEPTNO=c.DEPTNO
;
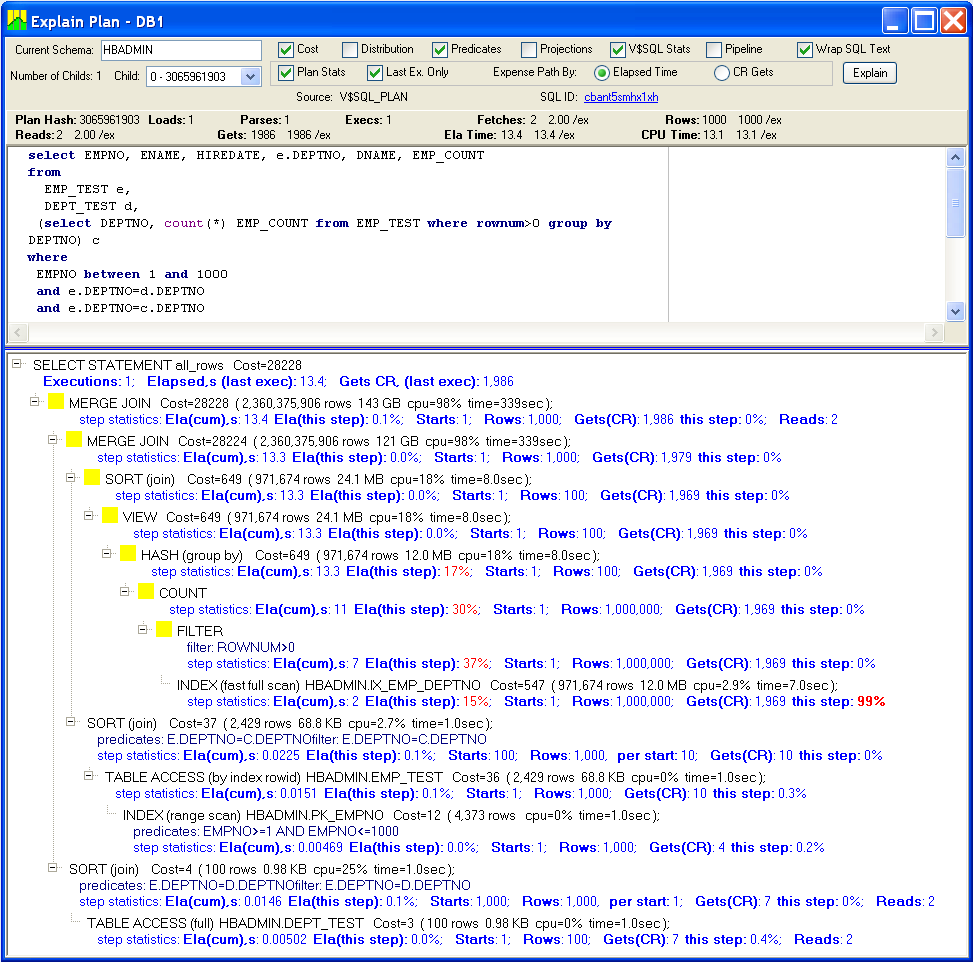
This run was substantially better; the execution time went down from 60 to 13.4 seconds:

The subquery was executed first, and then the result set was MERGE JOINed to the 1,000-row subset from EMP_TEST. Finally, another MERGE JOIN step joined the result set with the DEPT_TEST table.
You may wonder what these yellow blocks mean. This is how Lab128 highlights steps with substantial (>5%) elapsed time. This helps to identify problematic steps. The "FILTER (rownum > 0)" and "COUNT" steps contributed 67% of elapsed time - these steps were introduced by "rownum > 0" condition. This was surprisingly high. Let's not use this condition and use an Oracle hint instead.
Using NO_MERGE hint.
select EMPNO, ENAME, HIREDATE, e.DEPTNO, DNAME, EMP_COUNT
from
  EMP_TEST e,
  DEPT_TEST d,
 (select /*+no_merge*/ DEPTNO, count(*) EMP_COUNT from EMP_TEST group by DEPTNO) c
where
 EMPNO between 1 and 1000
 and e.DEPTNO=d.DEPTNO
 and e.DEPTNO=c.DEPTNO
;
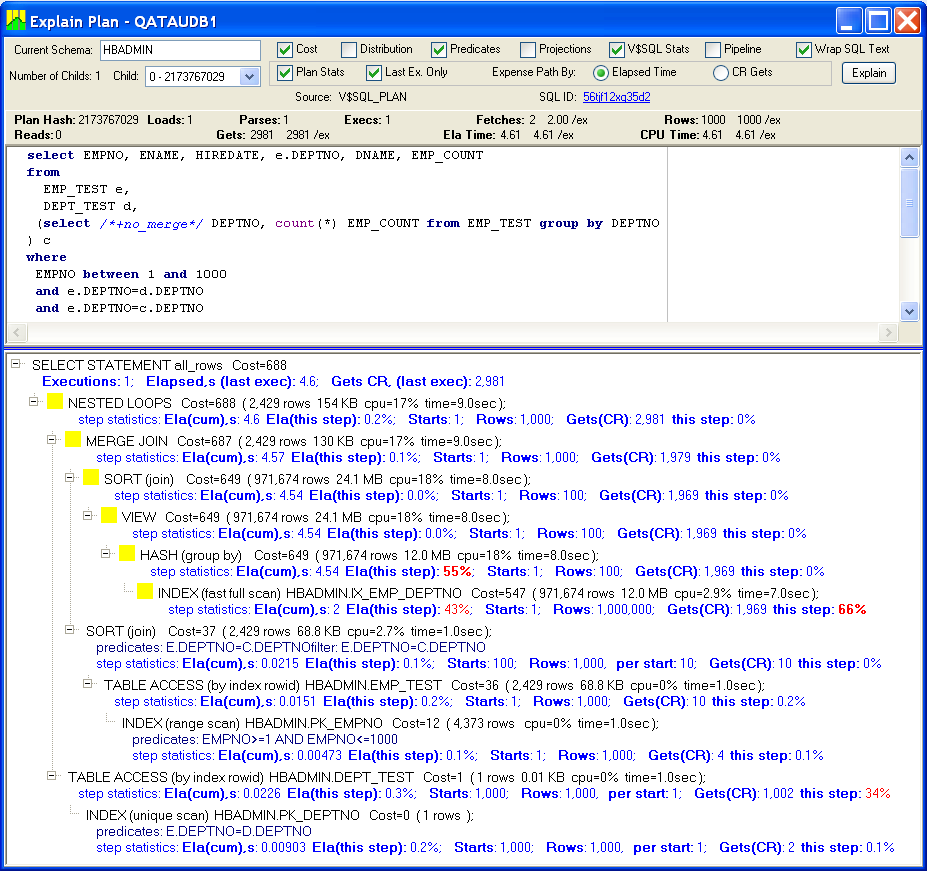
Removing "rownum > 0" actually helped a lot. The execution time improved from 13.4 to 4.6 seconds:

The query has very similar plan, only the overhead caused "rownum > 0" has been eliminated.
Once in a while you have a situation when a query has been running for a long time and it seems to never finish. Let's return to our original query and take Pstack snapshots using Lab128's feature described in "Advanced troubleshooting using pstack traces" in Top Processes.
We are going to start the query, wait a bit until the Oracle process executing our query pops up in the Top Processes window, and then select Pstack option in pop-up menu. We will take 20 snapshots; here is the report provided by Lab128:
| Host Name: | db12 | ||
| OS PID: | 25684 | ||
| Database: | Time: | Tue, 10/19/2010 3:20:41 PM, loc |
In this report function names are converted into Explain Plan operations when possible. Several pstack snapshots have been merged into the tree with the node frequency indicated in () parenthesis. When the call path deviated from other snapshots, a new branch was added to the tree. You should focus on finding the last frequent node having child nodes with significantly reduced frequency. This last node (function) is where the process has spent most of the time. This provides a clue on which step the query was spending time.
0. SELECT FETCH:  (20)
 1. HASH GROUP BY: Fetch (20)
  2. HASH JOIN: Fetch (20)
   3. INDEX UNIQUE SCAN: FetchFastFullScan (20)
    4. HASH JOIN: InnerProbeHashTable (20)
     5. HASH JOIN: WalkHashBucket (20)
      6. HASH GROUP BY: RowP (11)
       7. qeshLoadRowForGBY (11)
        8. qeshrGetUHash_Fast (6)
        8. qeshIHProbeURow_Simple (5)
         9. HASH GROUP BY: AggregateRecords (2)
          10. qesaFastMergeNonDist (1)
          10. qeshrGotoWorkArea (1)
         9. qeshrPUCompare (3)
          10. ?? (2)
      6. kxhrUnpack (7)
       7. rworupo (6)
      6. kxhrPUcompare (2)
#0  0x00000000024a4faf in rworupo ()
#1  0x0000000003067105 in kxhrUnpack ()
#2  0x0000000002dbd75a in qerhjWalkHashBucket ()
#3  0x0000000002dbd061 in qerhjInnerProbeHashTable ()
#4  0x0000000002e300e1 in qerixFetchFastFullScan ()
#5  0x0000000002e469f4 in rwsfcd ()
#6  0x0000000002dc0bef in qerhjFetch ()
#7  0x0000000002edae3b in qerghFetch ()
#8  0x0000000003003325 in opifch2 ()
#9  0x000000000317201a in kpoal8 ()
#10 0x0000000001362d84 in opiodr ()
#11 0x0000000003b4ee7e in ttcpip ()
#12 0x000000000135e454 in opitsk ()
#13 0x0000000001361374 in opiino ()
#14 0x0000000001362d84 in opiodr ()
#15 0x00000000013547a3 in opidrv ()
#16 0x0000000001f06032 in sou2o ()
#17 0x000000000071437b in opimai_real ()
#18 0x00000000007142cc in main ()


#0  0x00000000024a5059 in rworupo ()
#1  0x0000000003067105 in kxhrUnpack ()
#2  0x0000000002dbd75a in qerhjWalkHashBucket ()
#3  0x0000000002dbd061 in qerhjInnerProbeHashTable ()
#4  0x0000000002e300e1 in qerixFetchFastFullScan ()
#5  0x0000000002e469f4 in rwsfcd ()
#6  0x0000000002dc0bef in qerhjFetch ()
#7  0x0000000002edae3b in qerghFetch ()
#8  0x0000000003003325 in opifch2 ()
#9  0x000000000317201a in kpoal8 ()
#10 0x0000000001362d84 in opiodr ()
#11 0x0000000003b4ee7e in ttcpip ()
#12 0x000000000135e454 in opitsk ()
#13 0x0000000001361374 in opiino ()
#14 0x0000000001362d84 in opiodr ()
#15 0x00000000013547a3 in opidrv ()
#16 0x0000000001f06032 in sou2o ()
#17 0x000000000071437b in opimai_real ()
#18 0x00000000007142cc in main ()
...
The instructions in the report help to interpret the report. We can conclude that the process was spending most of the time in functions called by the "HASH JOIN" and "HASH GROUP BY" steps.
This test was conducted on 10g (10.2.0.4) and 11g (11.2.0.1) databases with default SQL Optimizer parameters:
optimizer_mode=ALL_ROWS
optimizer_index_caching=0
optimizer_index_cost_adj=100
optimizer_dynamic_sampling=2
db_file_multiblock_read_count=128
--drop table emp_test;
--drop table dept_test;

create table emp_test (
 empno number not null,
 ename varchar2(40),
 job varchar2(40),
 mgr number,
 hiredate date not null,
 sal   number,
 comm  number,
 deptno number not null
) nologging
;

create table dept_test (
 deptno number not null,
 dname varchar2(40) not null,
 loc varchar2(40)
)
;

declare
 n number := 0;
begin
 for i in 1..100 loop
  insert into dept_test values (i, 'dept_'||i,null);
 end loop;
 commit;
end;
/

declare
 n number := 0;
 rand number;
 type rec_type is table of emp_test%rowtype;
 data rec_type;
begin
 data := rec_type(null);
 data.extend(1000000-1);
 for i in 1..1000000 loop
  n := mod(n * 1664525 + 1013904223, 4294967295); -- get pseudo random number
  n := round(n,0);
  rand := n / 4294967295;
  data(i).empno := i;
  data(i).ename := to_char(n,'XXXXXXXX');
  data(i).deptno := 1 + floor(rand*100);
  data(i).hiredate := date'2000-01-01' + rand*365*9;
  data(i).sal := 50000+round(50000*rand,-3);
 end loop;
 forall i in data.FIRST..data.LAST insert into emp_test values data(i);
 commit;
end;
/

create unique index pk_empno on emp_test(empno) nologging;
create index ix_emp_deptno on emp_test(deptno) nologging;
create unique index pk_deptno on dept_test(deptno) nologging;

alter table emp_test add constraint pk_empno primary key (empno) using index;
alter table dept_test add constraint pk_deptno primary key (deptno) using index;

alter table emp_test add constraint fk_dept_no foreign key (deptno) references dept_test;

begin
 dbms_stats.gather_table_stats(
  ownname=> null
 ,tabname=> 'EMP_TEST'
 ,partname=> null
 ,estimate_percent=> 100
 ,block_sample=> false             -- no random block_sampling
 ,method_opt=> 'FOR COLUMNS SIZE 1'-- no col statistics (columns are not listed), no histograms (bucket size 1)
 ,degree=> 4                       -- parallelism degree
 --,granularity=>'AUTO'            -- auto-determined based on the partitioning type
 ,cascade=> true                   -- if true - indexes are analyzed
 --,stattab=> null                 -- User statistics table identifier describing where to save the current statistics
 --,statid=> null                  -- Identifier (optional) to associate with these statistics within stattab
 --,statown=> null                 -- Schema containing stattab (if different than ownname)
 ,no_invalidate=> false            -- false - means invalidate SQL area
 --,stattype=> 'DATA'              -- default DATA
 --,force=> true                   -- gather stats even it is locked
 );
end;
/

begin
 dbms_stats.gather_table_stats(
  ownname=> null
 ,tabname=> 'DEPT_TEST'
 ,partname=> null
 ,estimate_percent=> 100
 ,block_sample=> false             -- no random block_sampling
 ,method_opt=> 'FOR COLUMNS SIZE 1'-- no col statistics (columns are not listed), no histograms (bucket size 1)
 ,degree=> 4                       -- parallelism degree
 --,granularity=>'AUTO'            -- auto-determined based on the partitioning type
 ,cascade=> true                   -- if true - indexes are analyzed
 --,stattab=> null                 -- User statistics table identifier describing where to save the current statistics
 --,statid=> null                  -- Identifier (optional) to associate with these statistics within stattab
 --,statown=> null                 -- Schema containing stattab (if different than ownname)
 ,no_invalidate=> false            -- false - means invalidate SQL area
 --,stattype=> 'DATA'              -- default DATA
 --,force=> true                   -- gather stats even it is locked
 );
end;
/