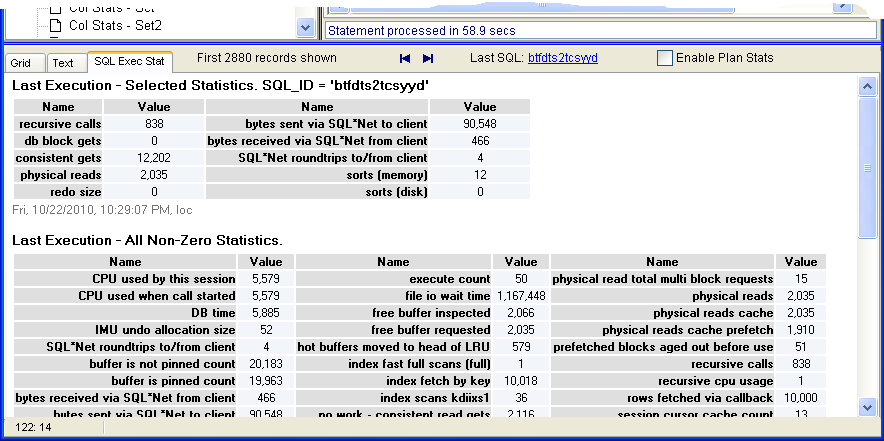
SQL execution statistics are also known as Autotrace in SQL Plus. When SQL statement is executed, the execution statistics are automatically collected. This is implemented by querying v$mystat before and after execution and then calculating delta. To view statistics, select "SQL Exec Stats" tab in the Data section, see picture below. The report has several sections: the most important statistics are shown in "Selected Statistics"; sometimes for advanced cases other statistics are needed, they are shown in "All Non-Zero Statistics" section; and for you convenience, the SQL text of the query is included in this report.

When troubleshooting SQL query, the execution statistics are the first thing to check. Execute the query and examine the numbers. If you have the query that executes very long, you can stop it by pressing Cancel button, the statistics are still reported and will show numbers collected "thus far". For more advanced diagnostics, consider collection of SQL Plan Statistics.
Another common use of Execution Statistics is for SQL optimization. Change the query or use a different hint, then execute and see if the efficiency improves.