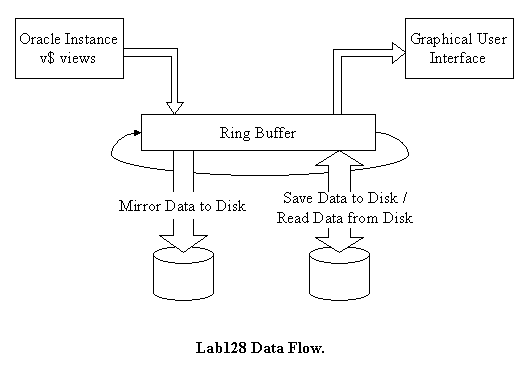
The data collection engine provides automatic querying of performance data (over 1000 statistics) at an adjustable (default 6 sec) rate, storing data in-memory with 64-bit precision using lossless compression. An open and highly customizable architecture allows for the expansion of measurement queries with user-defined queries. The engine provides random-access to the stored data. Collected data is normalized (interpolated to the standard moment in time) and differentiated, if necessary. Data in the in-memory database is available through the access engine using a query language that deals with the time series domain. The access engine supports time series arithmetic allowing for the definition of complex statistics. The set of statistics can be expanded with user-defined statistics using query expressions.
Lab128 uses an in-memory ring buffer to store performance data. When the ring buffer is full, its memory space is reused. Therefore, Lab128 maintaines data history in a moving time window. The buffer size affects the history length: on average, it takes about 0.5 MB to store 1 hour. This unparalleled efficiency makes it possible and practical to store data history ranging from a few hours to a few days.

The in-memory ring buffer can be mirrored to the disk. In this mode, Lab128 incrementally updates the data file several times a minute. If the aplication is closed and then restarted, the buffer data is restored from the mirrored copy. As a separate option, the user can save performance data into the file and later open it for analysis. This feature can be useful for Oracle performance consultants. The consultant can ask his/her client to collect data using Lab128, then save the collected data into a file and transfer it back for analysis. Finally, the Auto Save option can be used to save performance data at a regular time interval, generating a set of snapshots and providing continuous time coverage.
The rendering engine presents time series in the form of graphs. The user can choose statistics forming user-defined charts. All type of statistics, including user-defined statistics built on user-defined queries, can be combined in the charts. The charts provide a high degree of convenience in exploring and analyzing data. The correlation analysis is available using charts with one statistic shown as a function of another.
The snapshots of important Oracle views are stored in-memory. Data in the snapshots is compressed, allowing for the storage of very large datasets. The snapshots are aggregated and joined internally in the application, offloading the Oracle server. The snapshots are refreshed automatically at an adjustable rate; the changes propagate automatically through the joins and aggregations. This dynamic and constantly changing system of datasets forms a foundation for the number of monitoring forms and views, presenting convenient insight into Oracle instance internals. A great deal of attention was paid to the ergonomics and usability of the forms and views. Efficiency and performance have been recognized as part of usability; these areas had a high priority during the design and implementation of this application.
Lab128 is a multithreaded, high-performance application. It constantly monitors the status of Oracle connections, detecting problems and automatically re-establishing lost connections. The Instances Overview screen provides status and critical statistics for each instance that can be viewed at a glance. A built-in SQL editor with a repository for SQL queries provides additional flexibility and convenience.